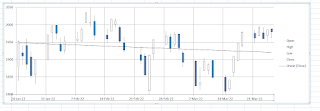
Candlestick chart, which graph Open, High low and close
plus linear regression line of the close
lines are high and low
thick bars are open and close
open lower than close, open bar rising prices
open higher than close, solid bar lower prices
1 year
2 months

a visual representation of the past 2 months of DWCPF, which converts to S fund by a formula i don't understand as of yet so any help appreciated
at least the linear regression slope seems to be flatter over the last 9 weeks and seems to have turned positive over the last 4 weeks


No comments:
Post a Comment